For many years, most scientists implicitly assumed that crustal-scale processes (eg., volcanism) and surface processes (eg., precipitation) operate at such different spatial and temporal scales that the latter would be unlikely to affect the former. However, data from high-precision, long-term, and continuous sensor networks are beginning to show that, instead, processes operating deep within the Earth are sensitive to events happening at or near its surface. For example, uplift in the Sierra Nevada detected by a network of GNSS stations (it's the same idea as GPS) was found to be caused by seasonal changes in groundwater levels and a long-term drought (Amos et al., 2014, Nature).
In a paper published in Geophysical Research Letters, George Hilley and his colleagues analyzed data from the GNSS network and a CO2 (carbon dioxide) sensor near the Mammoth Mountain ski area along the eastern slope of the southern Sierra Nevada. The goal of the study was to understand the processes controlling changes in the local emissions of CO2.
The CO2 sensor is near Horseshoe Lake. The Mammoth Mountain ski area is shown in the right half of this Google Earth image.
CO2 levels in this area are closely monitored because they are a potential health hazard. CO2, which is emitted from volcanic vents, is heavier than air and accumulates in low-lying areas, thereby displacing oxygen-rich air. Because CO2 is odorless and colorless, unsuspecting animals (including humans) can enter these areas and become asphyxiated. Tragically, in 2009, three members of the Mammoth Mountain ski patrol fell into a pit that was venting CO2 and died. The long-term effects of these high CO2 levels can be seen along the shores of Horseshoe Lake, where a patch of forest has been killed by the lack of oxygen.
Trees along the shore of Horseshoe Lake killed by high CO2 levels. The colorless gas is emitted from volcanic vents in the area. Photo credit: Deborah Bergfeld.
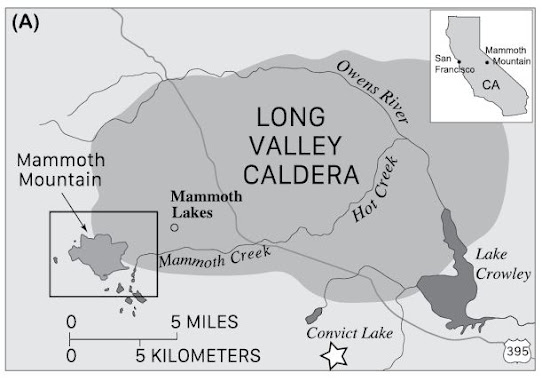
While the volcano that caused this eruption is long gone (in fact, it was obliterated during the eruption 760,000 years ago), magma continues to form beneath the surface. One of the more enjoyable consequences of this magma formation is the collection of hot springs that dot the area. In fact, there's even a 'hot' river (see 'Hot Creek' on the map above).
Nature's hot tub in the Long Valley Caldera. The water is heated by magmatic activity.
When rocks are heated and melt to form magma deep within the Earth, CO2 is created which, because it's a gas, rises up and escapes out of cracks ('vents') in the crust. Therefore, in addition to health concerns, monitoring the emission of CO2 near Mammoth Mountain also provides critical information on magma formation and potential volcanic hazards in the area.
Which brings us back to the study published by George Hilley and his colleagues. To accurately interpret the CO2 measurements and understand what they are telling us, we have to account for all the different processes that might affect CO2 emissions. For example, does an increase in CO2 signal an imminent eruption, or is there a more benign explanation? One interesting and mysterious feature of the CO2 emissions is their seasonality: previous studies have found that CO2 emissions (or 'fluxes') systematically increase in the summer and decrease in the winter (Lewicki, 2021, Journal of Volcanology and Geothermal Research).
CO2 emissions at Horseshoe Lake from 2015 to 2020. The peaks occur in the summer and the lows occur in the winter. An earthquake swarm hit the region during the period shown by the gray band. After these earthquakes, the overall CO2 fluxes decreased, but the seasonal variations continued. Figure 2 from Hilley et al. (2022).
Hilley and his colleagues proposed three hypotheses to explain this seasonal waxing and waning of CO2 emissions. One idea was that, during the winter, snow on the ground might be trapping the CO2 in air pockets, and during the summer, when the snow melts, the trapped gas is released. A second potential explanation was that the source of the CO2 emissions is shifting locations throughout the year. Finally, their third hypothesis posited a relationship between winter precipitation and the stresses on the Mammoth Mountain Fault, which likely serves as an important conduit for CO2 rising up to the suface.
The Mammoth Mountain Fault (MMF), which may be an important conduit for CO2 rising to the surface, is shown in the map below. The proximity of the fault to the CO2 sensor (EC Station) suggests that changes in the ability of the fault to transmit CO2 may be responsible for the seasonal changes in local CO2 emissions. Figure 1B from Hilley et al. (2022).
In the region, precipitation is strongly seasonal, with most of the rain and snow falling during the winter months. Data from the GNSS network has shown that all of this water is heavy enough to cause the crust to sag during the winter, and then pop back up during the summer, when the water runs off and evaporates (Amos et al., 2014, Nature). Hilley and his colleagues reasoned that, in the winter, the increased stresses on the crust could affect the ability of the fault to transmit CO2; for example, by squeezing the passages that allow the gas to rise - a process they refer to as "fault valving." The data appear to support this hypothesis.
At high stresses (towards the left on the x-axis), CO2 fluxes decrease. These results support the hypothesis that the weight of the water on the crust squeezes passages that allow gases to rise up through it, thereby throttling the emissions of CO2. Figure 4E from Hilley et al. (2022).


Comments
Post a Comment