Mountainous landscapes, because of their deep valleys and tall peaks, support a wide variety of microclimates. These microclimates, in turn, provide homes for a diverse assortment of plants and animals. A study by Daniel Cayan and his colleagues, published by the Parks Stewardship Forum, investigated the phenomenon of cold air pools in Devils Postpile National Monument, just north of Mammoth Mountain.
Location of Devils Postpile National Monument (red dot on map). From Figure 1 of Cayan et al.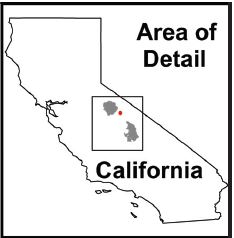
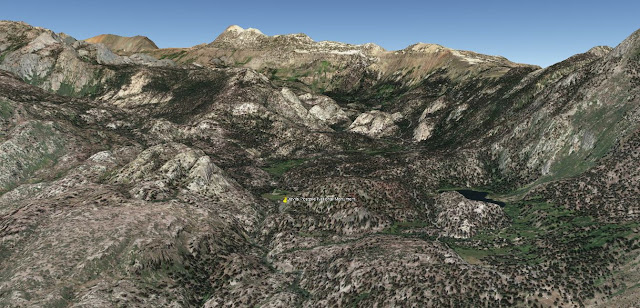
Google Earth Image of the study area. The center of the image is a deep valley that supports pools of cold air. This region is in the headwaters of the San Joaquin River.
Cold air pools are localized areas of cold air that develop along valley bottoms, typically at night. Because these are persistent features, they can serve as refuges for plants and animals as they slowly adapt to a warming climate. Given the potential importance of cold air pools to ecosystems, Cayan and his colleagues analyzed a 10-year record of temperatures measured from dozens of sensors distributed throughout a 2500-hectare area, in the Devils Postpile area, that spanned a difference of elevations of about 1000 m.
Figure 5 from Cayan et al. This is a map showing elevations (green to brown) and early morning August temperatures (blue to red). The dark green colors represent the valley bottom and the dark brown represents the ridges (the Google Earth image below shows the area). The coldest temperatures (blue) are along the bottom of the valley.

This is the area represented by the map shown above. The white area in the center-right of the image is the Mammoth Mountain ski area.

Typically, cold air is found at higher elevations rather than lower elevations; as a result, these cold air pools are examples of a temperature inversion. This can be clearly seen in some of the data presented by the authors.
Temperature data from sensors at different elevations illustrating a temperature inversion. Temperatures are colder down in the valley but then increase with elevation. The red line shows that the cold air pool was about 1000 meters thick on August 28, 2015. Figure 12 from Cayan et al.

One of the most interesting results from this work is that the strength of the temperature inversion (meaning the difference between temperatures at lower elevations and higher elevations) varies seasonally and peaks during the warmest part of the year.
This is a plot of the annual difference in temperatures between low- and high-elevation sites. The smallest difference is in the spring but the greatest difference is during the summer, when overall temperatures are the warmest. Figure 9 from Cayan et al.

The fact that the temperature inversions are strongest during warm periods is important because it suggests that locations that host cold air pools could be critical for maintaining plants and animals that rely on cooler temperatures when temperatures, overall, are increasing due to global warming. Moreover, as the authors note, not only are the cold air pools directly beneficial to the flora and fauna, but they also help maintain their environments by reducing evaporation and, thereby, keeping soil moistures high and preventing meadows from drying out.
Comments
Post a Comment